Taggbox Analytics helps you to track the impact and engagement of your social media wall. You can use it to generate reports and keep a track on how your social media content is performing.
How to Enable Analytics?
Step 1. Once you have created a wall, open the Wall Editor.
Step 2. With the help of “Add Feeds”, choose the correct feed source to integrate the desired social media feeds to your wall.
Read more: How to add feed?
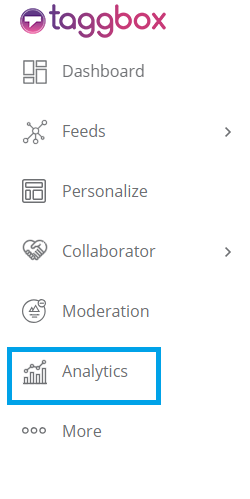
Step 3. Now, click on the Analytics option. (You will find it on the left sidebar in Wall editor).
Step 4. A new tab will open. Here, click on “Enable Analytics” to enable the analytics for your wall.
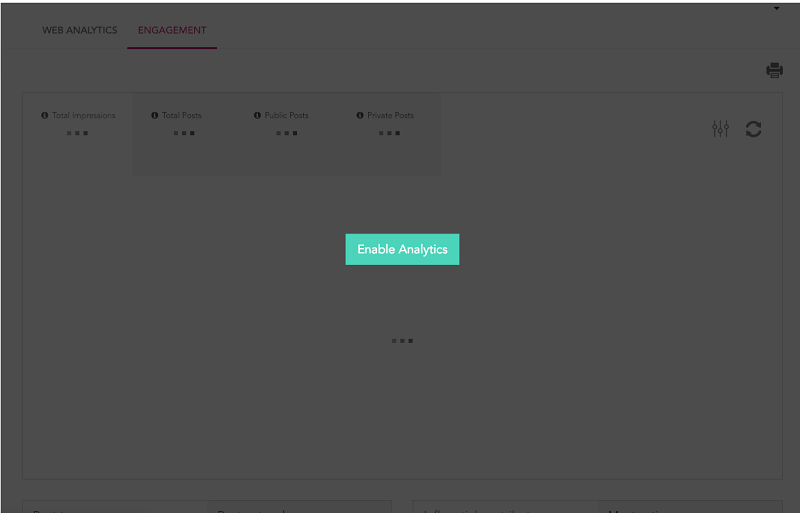
You have successfully activated the Analytics option for your wall. You can see two sections here – the Engagement Analytics and the Web Analytics. Let’s start by explaining the Engagement Analytics.

Engagement Analytics
Engagement Analytics provides you with the result of last week’s as well as a month’s activity across all feeds. You can also look for a different result by adjusting the date range. You could also filter your feed Analytics through the filter option available.
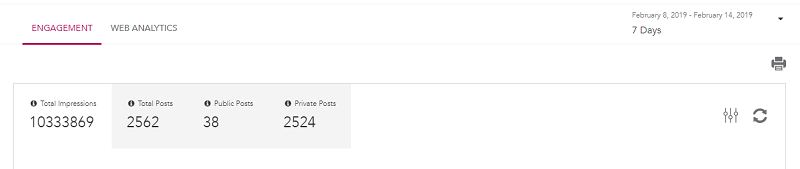
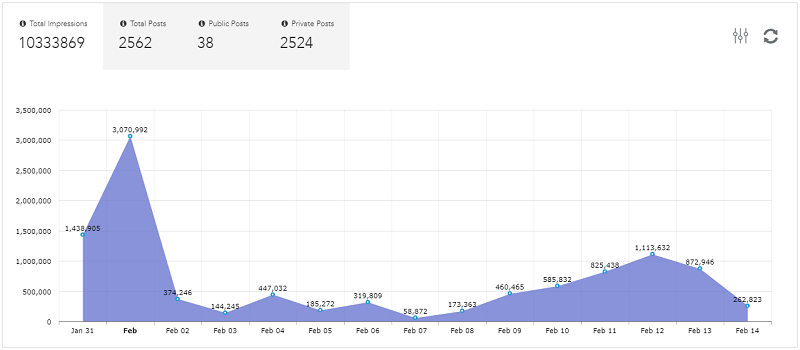
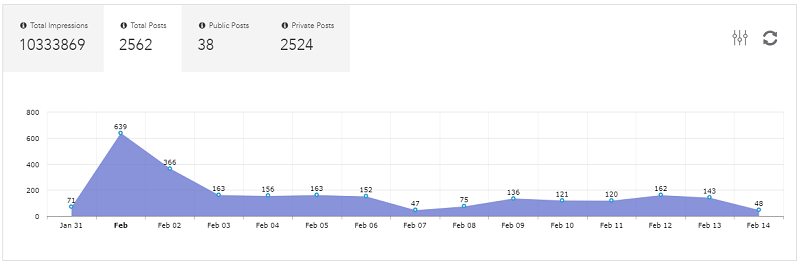
Total Impressions
Shows the total number of times users have seen the campaign over a period of time. You can also see in graphical form.
Total Posts
Shows the total number of posts aggregated on the social wall (Both public and private).
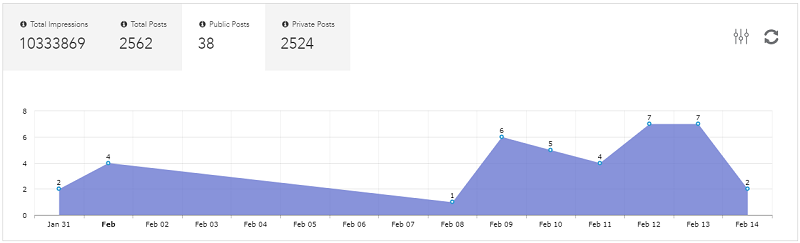
Public Posts
Shows the total number of posts that are public or approved to be public through moderation.
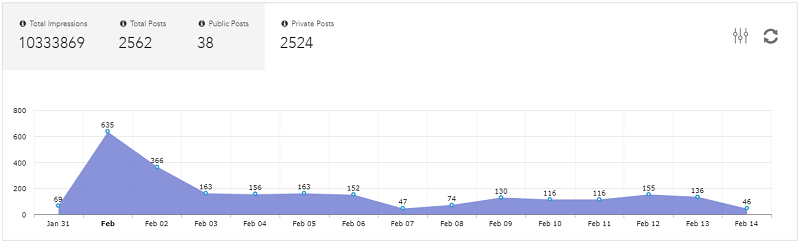
Private Posts
Shows the total number of posts that are private or are still in the moderation queue.
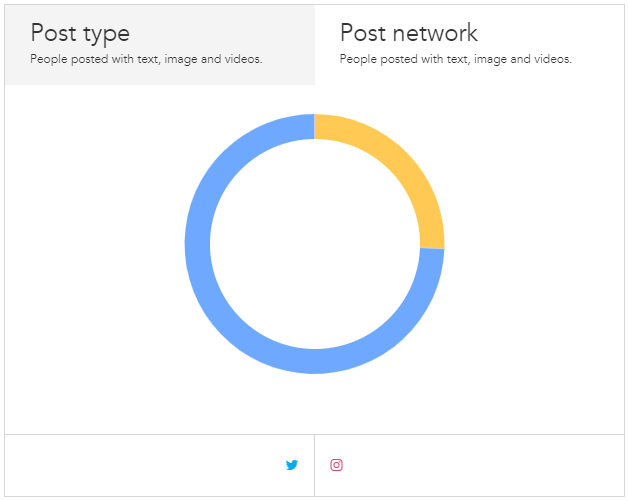
Posts Type
Reflects the post type such as images, text, video, etc.
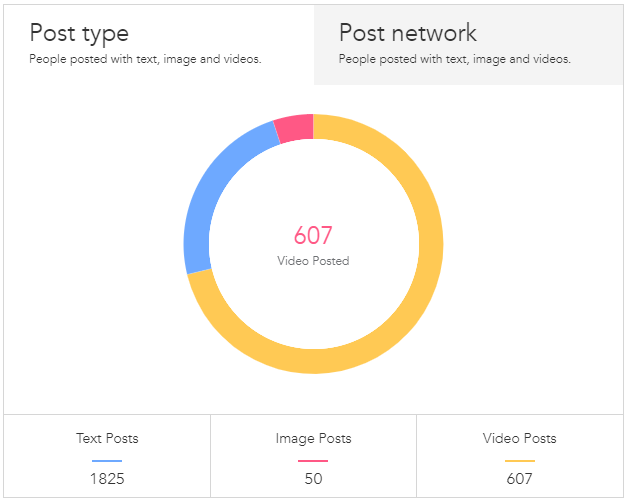
Posts Networks
Displays the posts per social network.
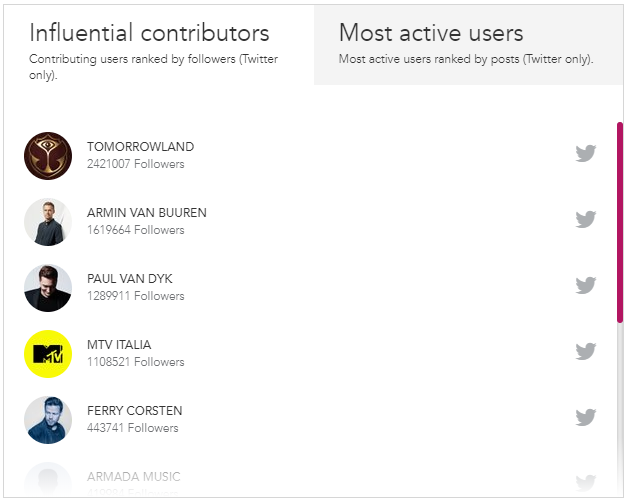
Influential Contributors
Displays a list of users ranked by the maximum number of followers.
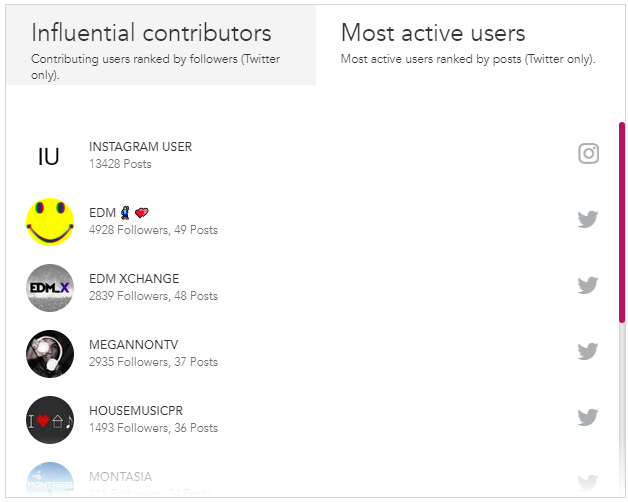
Most Active Users
Displays a list of users sorted by maximum number of posts.
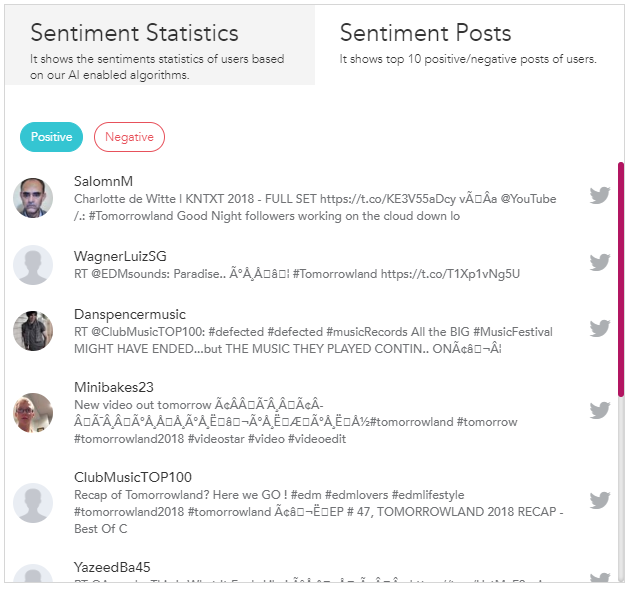
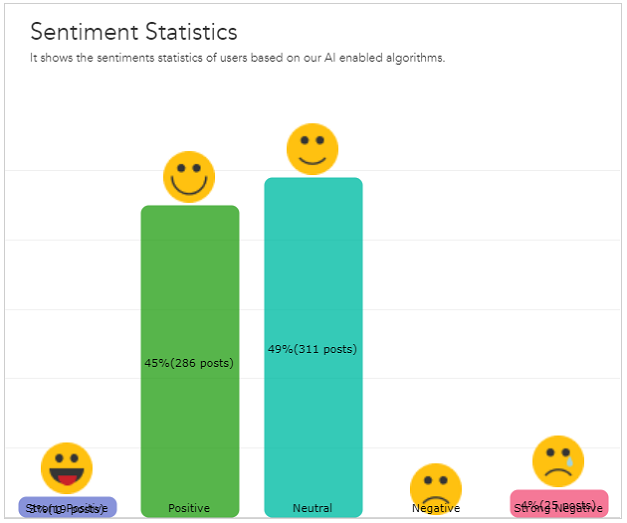
Sentiment Statistics
Displays the sentiment statistics of users based on our AI enabled algorithms. It displays if a brand’s hashtag has got strong positive or strong negative reactions.
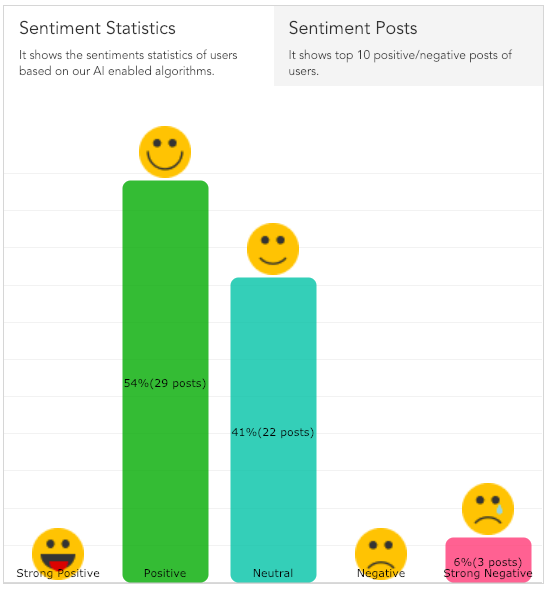
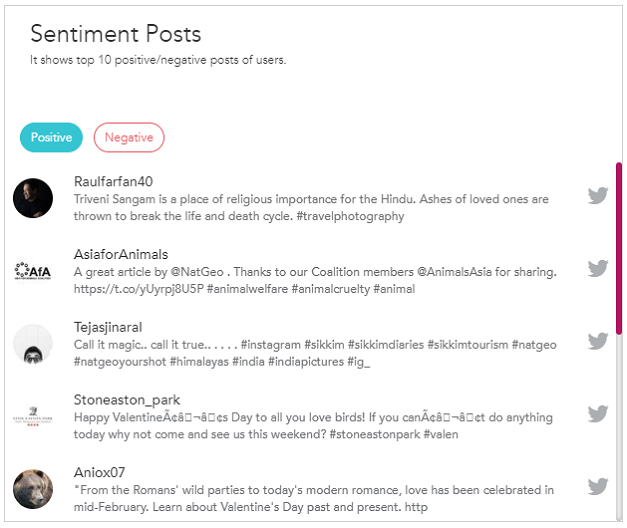
Sentiment Posts
It shows the top 10 positive and negative posts of users.
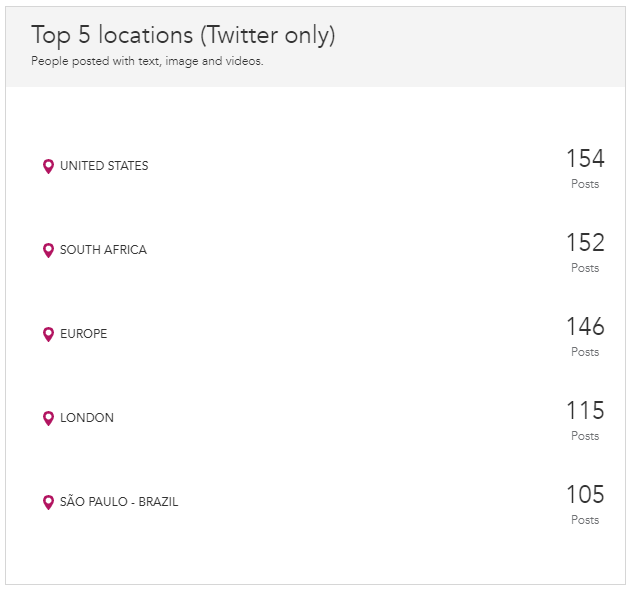
Top 5 Locations
Displays the posts country wise (the data is only for Twitter users).
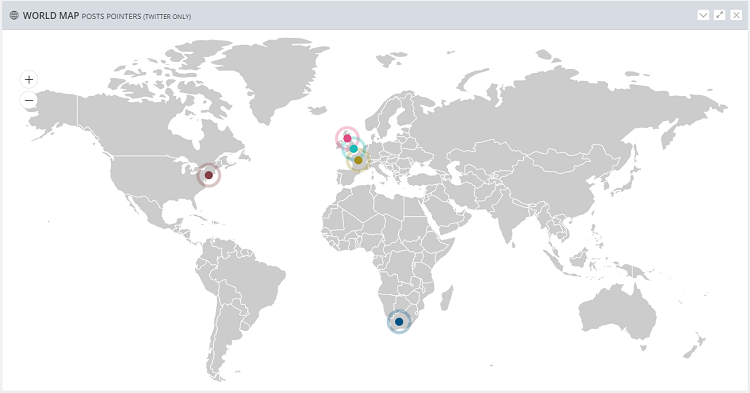
World Map
Shows pointers of locations around the globe only for Twitter posts.
Web Analytics
It is especially for website embeds and gives you result of the last week’s activity across all feeds.
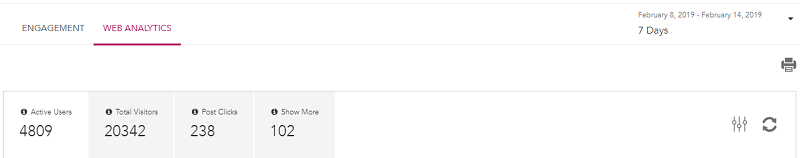
Active Users
Reflects the number of users active on your website.
Total Visitors
Reflects the total number of visitors on your website.
Post Clicks
Shows the total number of times posts have been clicked on your website.
Show More
Number of times users click on Show more on your wall.
Sentiment Statistics
Displays the sentiment statistics of users based on our AI enabled algorithms. It displays if a brand’s hashtag has got strong positive or strong negative reactions.
Sentiment Posts
It shows the top 10 positive and negative posts of users.
If you have any query or need help, please Contact us or write us at support@taggbox.com.