
Read summarized version with
Many brands are leveraging user-generated content as a solitary marketing strategy, as 86% find UGC the most effective content to showcase their brand’s authenticity. However, every successful marketing strategy begins with a target-oriented approach.
As a marketer, you must have a set of goals in your mind. Once your UGC campaign is live, these goals help you understand how well you laid out your marketing blueprint to reach your goals or achieve less/more than your set targets.
But how does one get to know that? It all becomes easier when calculating your UGC campaign’s return on investment. When you create an ROI-driven approach for your UGC marketing campaigns, it becomes easy to calculate your campaign’s success and helps you understand the areas you need to focus on.
Factors To Consider While Calculating UGC Campaign ROI:
- Content creation costs
- Revenue spent on paid social ads
- Value of your visual content library
- Cost per click (CPC)
- Overall conversions
So, how does one measure the ROI of their UGC Marketing campaigns? Here is your 101 guide to measuring the success & ROI of your marketing campaigns ft. UGC.
The Influence Of User-Generated Content On Today’s Consumer
Today’s consumer is someone who seeks transparency from brands. They turn a blind eye to flashy advertisements & marketing gimmicks and actively engage with content created by their fellow consumers.
As a marketer, you can no longer push your brand to the masses, and that’s why brands have become more inbound with their marketing. 41% of marketers confirm inbound produces measurable ROI. Besides, user-generated content plays an important role in the inbound marketing cycle.
User-generated content holds the ability to attract, inspire, engage and convert a user single-handedly without even being too pushy. 79% of consumers say user-generated content strongly influences their purchasing decisions.
So what indicates the success of user-generated content marketing campaigns? Keep reading to learn about the KPIs for different marketing touchpoints.
UGC Campaign KPIs For Different Marketing Touchpoints
Wondering how you can measure the success of your user-generated content campaign? Well, the KPIs differ for each marketing touchpoint. That’s why we have decided to break it down for you.
1. UGC Campaign KPIs For Websites
- Website Dwell Time: This is the average duration of time your website visitors stay on your website.
- Bounce Rate(%): It can be indicated by calculating that out of the number of people who visited your website, who exited immediately.
- CTA Click-through Rate: Number of clicks you receive on your website CTAs.
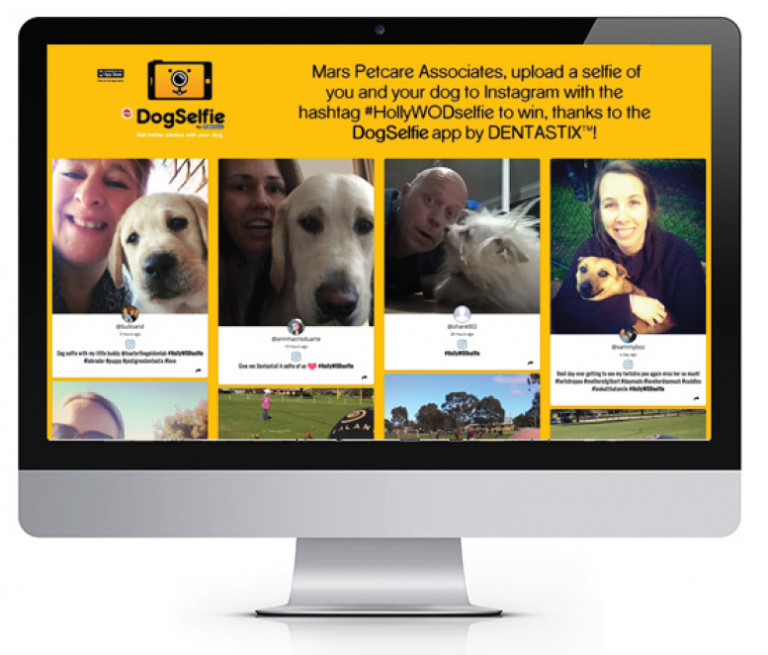
According to a 2021 study, Website Visitors spend 90% more time on websites that include UGC galleries, leading to lower bounce rates. That’s how Pedigree Australia improved its website performance with their #HOLLYWODselfie campaign that they embedded on their website.
2. UGC Campaign KPIs For Social Media
- Profile Visits & Impressions: This indicates the number of social media users who came across your posts and were encouraged to visit your social profile.
- Followers Growth Per Month: The number of followers you gain each month as you start your UGC campaigns.
- Content Resharing: The number of people who found your social content intriguing enough to share with their followers.
- Hashtag Reach: Many social platforms like Instagram, Twitter, Linkedin, Pinterest, and YouTube offer you hashtag insights that tell you how many people are using your hashtags. This helps you track the performance of your UGC hashtag campaigns on social media.
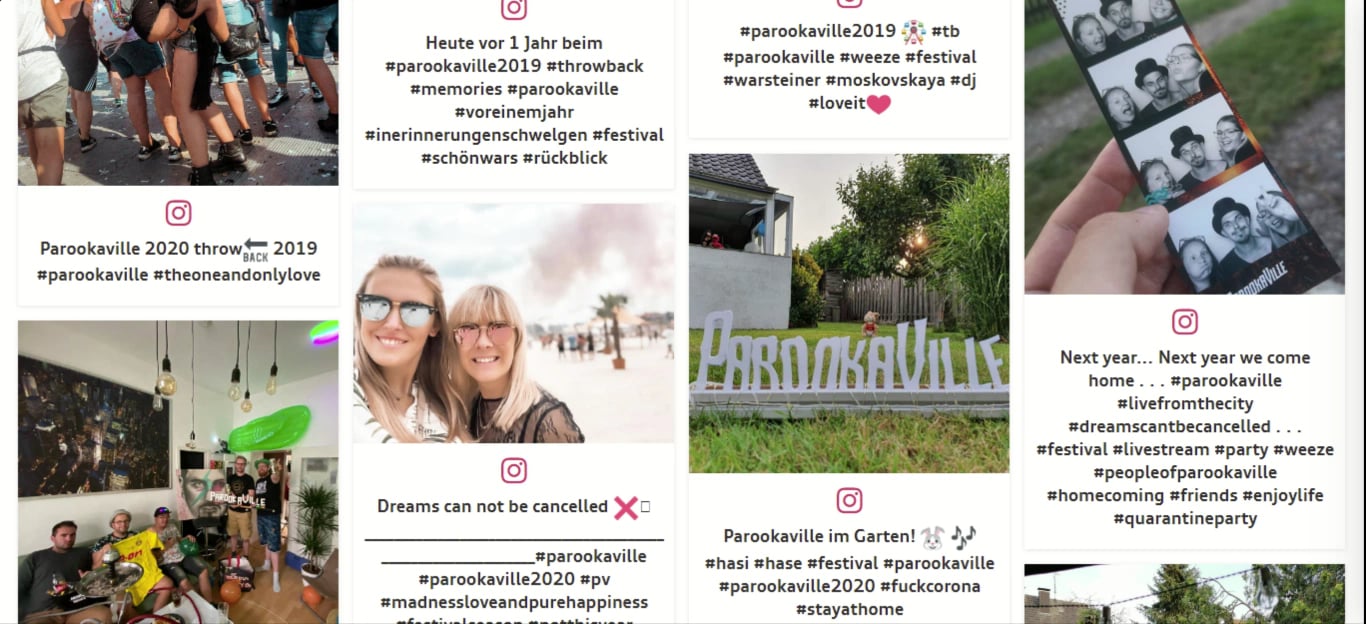
Social campaigns that incorporate UGC see a 50% lift in engagement. Parookaville, a world-popular music festival from Germany, ran a social media campaign with #dreamscannotbecancelled for their concert during the pandemic and saw a major boost in engagement, profile visits, followers and more.
3. UGC Campaign KPIs For Email Campaigns
- Email Click-Through Rates: This is the number of people who clicked on the links on your UGC email campaign compared to those who opened the email.
- Conversion Rate Optimization: Many brands send automated cart abandonment emails to their customers. When incorporated with UGC, brands have witnessed 30% higher conversion.
- Unsubscribe Rate: The number of email receivers who have unsubscribed from your email list.

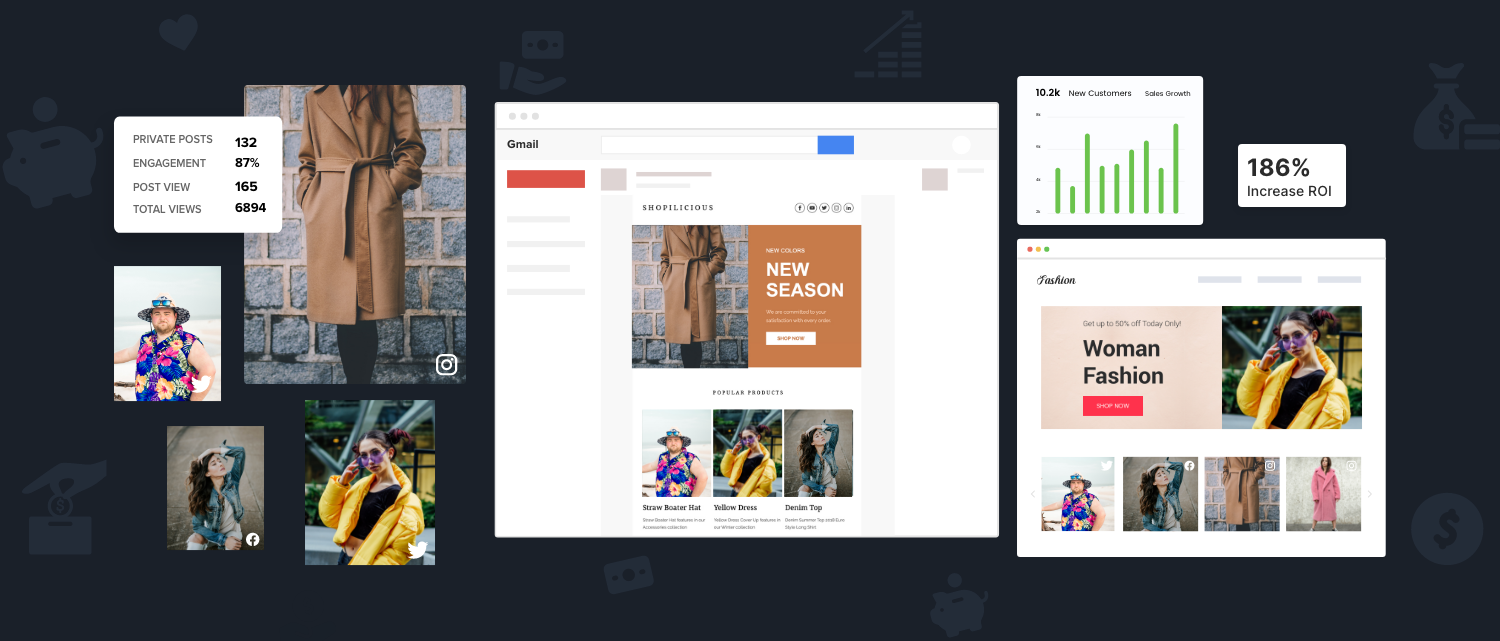
UGC drives a 73% increase in email click-through rates. For example, when Amazfit started using UGC in their emails, their click-through rates rose by an average of 8 per cent.
4. UGC Campaign KPIs For Social Ads
- Profile Visits: The number of people who came across your social ad and clicked on your profile to explore more about your brand.
- No. Of CTA Clicks: Every Social Ad comes with a CTA. If it’s ecommerce, it can be “Buy Now,” for applications, it can be “Install Now.” CTA clicks are a major KPI to indicate the success of UGC in your social ads.
- Conversion & Sales: Out of the number of your target audience, all converted into your customer indicates this KPI.

Toyota increased its Facebook ad engagement by 440% using UGC with the launch of Feeling The Street – a global campaign highlighting and celebrating the world’s best street performers.
5. UGC Campaign KPIs For Ecommerce
- Conversion rate: (the number of conversions/the total number of visitors) x 100. For example, if an ecommerce store receives 2000 visitors in a month and has 1500 sales, the conversion rate would be (1500/2000) x 100 = 75%.
- Shopping Cart Abandonment Rate: 25% of users leave an abandoned cart when they don’t find a brand trustworthy. Incorporating trust-building user-generated content can improve your credibility and decrease cart abandonment.
- CTAs’ Click-through Rate: Number of clicks you receive on your CTAs
- Churn Rate: The rate at which customers stop doing business with a company over a given period of time. It can be calculated by:
Customer Churn Rate:
(Customers Beginning Of Month – Customers End Of Month) / Customers Beginning Of Month; Example, (600-450)/600 = 25%

Eureka Street Furniture received Monthly 2K Clicks, +15% Revenue, and +78% Engagement on their ecommerce store since the integration of Shoppable Instagram & UGC galleries.
6. UGC Campaign KPIs For Digital Displays
- Engagement Rate/User Response Rate: When it comes to digital displays, engagement rate can be an umbrella term for many things. It varies depending on what you showcase on display and how your audience responds to that. It can be a QR code, your web pages, UGC Wall, etc.
- Customers Acquired: This is the number of customers you have managed to acquire by showcasing UGC on your digital displays.
- Community Building: No. of audience members who got influenced to create UGC for your community.

UGC fosters community building. When you showcase user-generated content on any digital screen, it creates social proof among the viewers, encouraging them to create UGC for you. For example, Etihad Arena leveraged UGC Social Wall to their space through large-size LCDs and Pillar Wraps and received an estimated 84,140 social media interactions and 1054 user-generated content collected within two days.
Boost Your Marketing ROI With UGC
Key Factors Indicating The Success Of UGC Marketing
Here we have laid out some key factors that indicate your user-generated content marketing campaign success. Of course, you can consider many aspects that differ per each brand’s unique goals; these factors help set the tone.
Lower Content Creation Cost
B2B marketers spend 39% of their marketing budgets on content. This budget majorly goes into content creation, especially on SaaS marketing strategies. You have to spend on professional photographers, models, content creators and more to build content from scratch every other day.
Guess what? You can eliminate all these steps with user-generated content, directly contact your brand’s UGC owners for rights and incorporate their content into your marketing. UGC has proven for brands to be a time & capital-saving asset.
Creating An Omnichannel Presence
User-generated content marketing is all about content re-purposing. You can repurpose the rich content created by your customers across any and every marketing touchpoint. It enables you to create an omnichannel presence, be it emails, web pages, social media, ads, digital displays, etc.
That’s the power user-generated content holds. It has proven to be effective & affective for brands to create an impactful omnipresence, keeping their customers’ voices front and centre. It’s all about bringing UGC beyond social media and boosting the ROI.
Winning Prospects Through Transparency
Millennials say that information received through UGC is trusted 50% more than information from other media sources. That’s because user-generated content is the honest and transparent voices of customers who have had their share of experiences with brands.
User-generated content helps brands grab the prospects’ attention and win their trust by offering content that’s far more reliable and unique than their competitors, making them stand-out.
Building Deeper Brand-Customer Relationships
Creating marketing campaigns driven by user-generated content fosters community building and customer loyalty. User-generated content works as social proof, meaning everyone who interacts with your UGC campaign feels connected to your brand. As a result, it increases the chances of them choosing you over your competitors.
Not only that, but when your customers see how you have given them centre stage, they root for your brand, and the chances of them recommending your brand to their network get higher, turning them into your brand advocates.
Bringing In More Revenue
Incorporating UGC marketing is proving to bring more revenue for brands. That’s because, while conversion remains the end goal for brands, it is no longer just selling- it’s a marketing mix of user engagement, trust, retention, and more. And all this becomes more achievable with user-generated content marketing.
Authenticity speaks to consumers and inspires them to buy. 79% of people say UGC highly impacts their purchasing decisions. This stat speaks volumes because consumers now prefer a true human voice over a perfectly crafted brand message.
Customer Retention Rate
A brand’s success is not measured by the number of new customers they have received but rather by the number of existing customers who keep coming back to make multiple purchases. Now that involves a lot of factors, starting from the customer services you offer, your product quality, your brand image and more.
When leveraged throughout the customer journey, user-generated content can make all this seem easily attainable. From the beginning, when the customer interacts with your brand to the point they have made the final purchase and even after that, to keep the conversation going, user-generated content can play a huge role in customer retention.
Calling It A Wrap!
Well, now that you know the UGC Campaign for different marketing touchpoints and the key factors that indicate the success of UGC marketing, how about getting UGC in action? Book a demo with our UGC experts today!
Boost Your Marketing ROI With UGC